












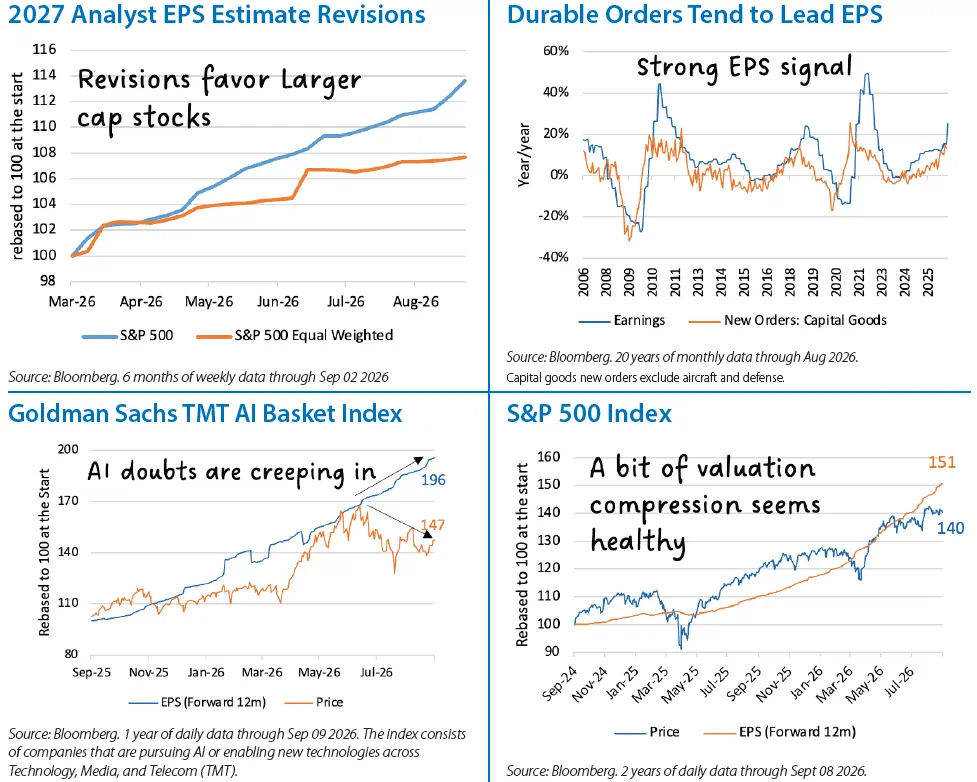
- Our constructive outlook toward U.S. large cap equities remains intact. Economic data continue to support expansion, while corporate earnings have remained exceptionally strong despite geopolitical uncertainty and elevated interest rates.
- The most important change since last month is that the oil shock has crossed from a geopolitical nuisance into a potentially meaningful inflation-and-discount-rate problem. So far, this looks more like a challenge to equity valuations than a threat to earnings, however tail risks are increasing.
- The fundamental backdrop remains unusually strong. Rather than cutting forecasts which typically occurs as a quarter progresses, analysts have raised S&P 500 earnings estimates for the second consecutive quarter while the broader earnings revision cycle has remained positive for 21 straight weeks. For now, stronger earnings continue to offset much of the pressure from higher interest rates.
- Improving economic data continues to reinforce that earnings outlook. Manufacturing activity remained strong in August, while Durable Goods New Orders excluding Transportation rose 13.2% year-over-year. Together, these indicators suggest business investment remains healthy and the industrial economy continues to expand.
- AI remains the dominant driver of economic growth and earnings, but AI-related stocks have lost some momentum over the past three months. Investors are questioning model competition and pricing, as well as potential constraints on data center construction and financing. Meanwhile, enterprise adoption is growing, but evidence of widespread productivity gains remains limited. This is not surprising as past technology revolutions took years to generate measurable productivity gains, and rapidly improving AI models make deployment a moving target.
- We continue to believe the secular bull market remains intact. Strong earnings, improving economic activity, and expanding AI adoption support our constructive outlook. Nevertheless, elevated valuations, concentrated leadership, and uncertainty surrounding the next phase of the AI investment cycle suggest periods of consolidation should be expected.
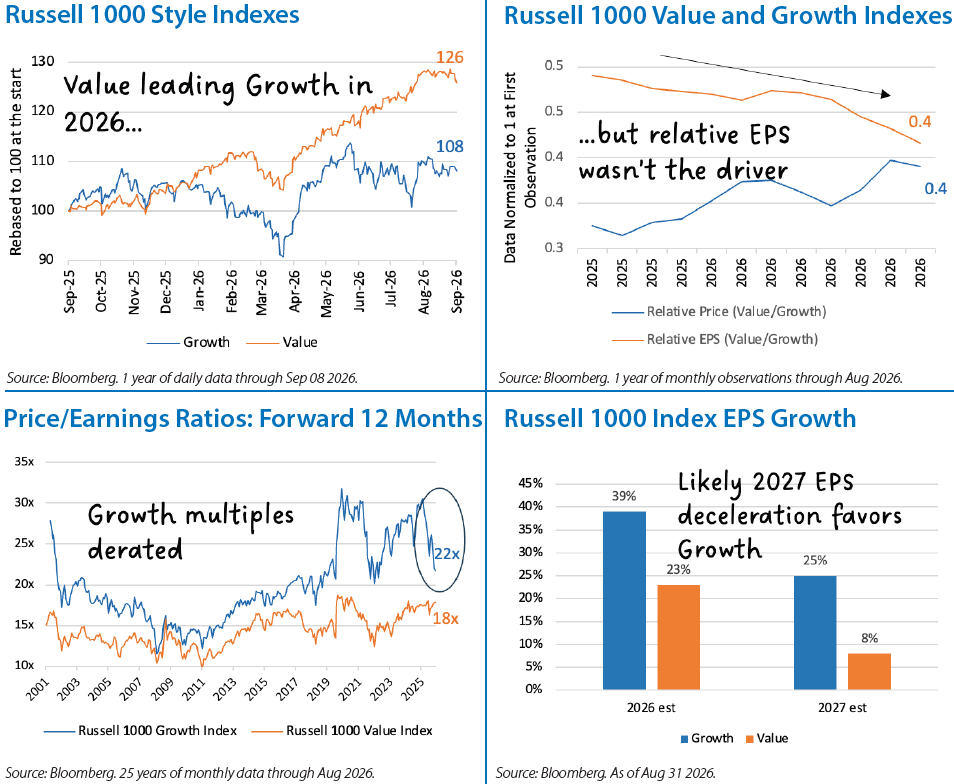
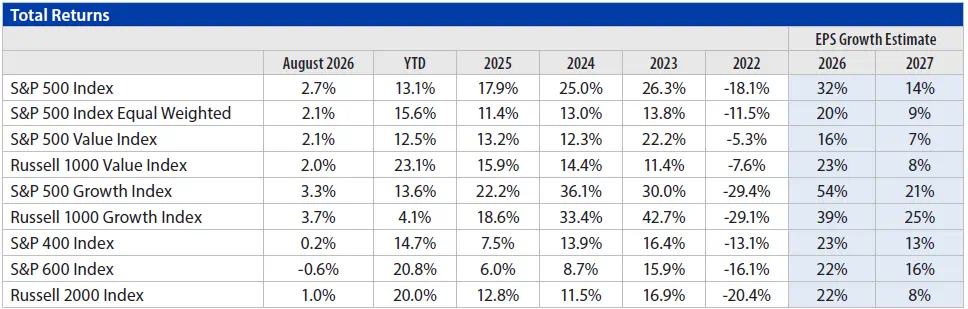
- We remain near our strategic allocations between Growth and Value. The performance gap remains striking - Russell 1000 Value is up 22.1% year to date through September 8 versus just 4.1% for Russell 1000 Growth - but we continue to believe the headline style labels obscure more than they explain. Index composition and stock-specific earnings drivers have been unusually important this year.
- Semiconductor stocks that helped drive Value's early-year outperformance migrated into Growth during the June reconstitution, making historical comparisons less useful. Despite that change, Value has continued to outperform, reinforcing our view that this year's leadership cannot be reduced to a simple Growth-versus-Value factor call.
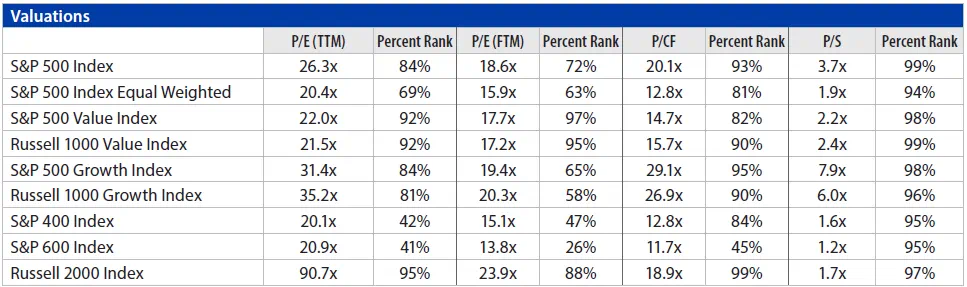
- Value's outperformance has not been driven by stronger earnings growth. Growth index earnings have substantially outpaced Value this year, but Growth's P/E multiple has fallen from roughly 30x to 22x, while Value's multiple has been relatively stable. In other words, much of Value's relative performance advantage has come from investors paying less for Growth's superior earnings rather than paying more for Value.
- Whether that rotation continues may therefore depend less on relative earnings growth and more on whether Growth valuations have sufficiently reset. With Growth continuing to generate stronger earnings increases, we do not believe this year's Value outperformance alone makes a compelling case for a significant style shift.
- The earnings outlook is becoming more supportive of Growth. Russell 1000 Growth earnings are expected to rise roughly 25% in 2027, compared with about 8% for Value. At the same time, Growth's forward P/E has fallen substantially over the past year despite stronger earnings growth, while Value's multiple has been relatively stable. That combination of stronger expected earnings growth and a lower valuation hurdle could improve the relative opportunity for Growth.
- We remain balanced between Growth and Value, but the relative opportunity may be shifting. Growth has undergone a meaningful valuation reset even as its earnings advantage has strengthened, improving its risk/reward relative to earlier in the year. To justify shifting our Growth/Value style allocation, we would need to see continued earnings delivery and greater clarity around AI returns.
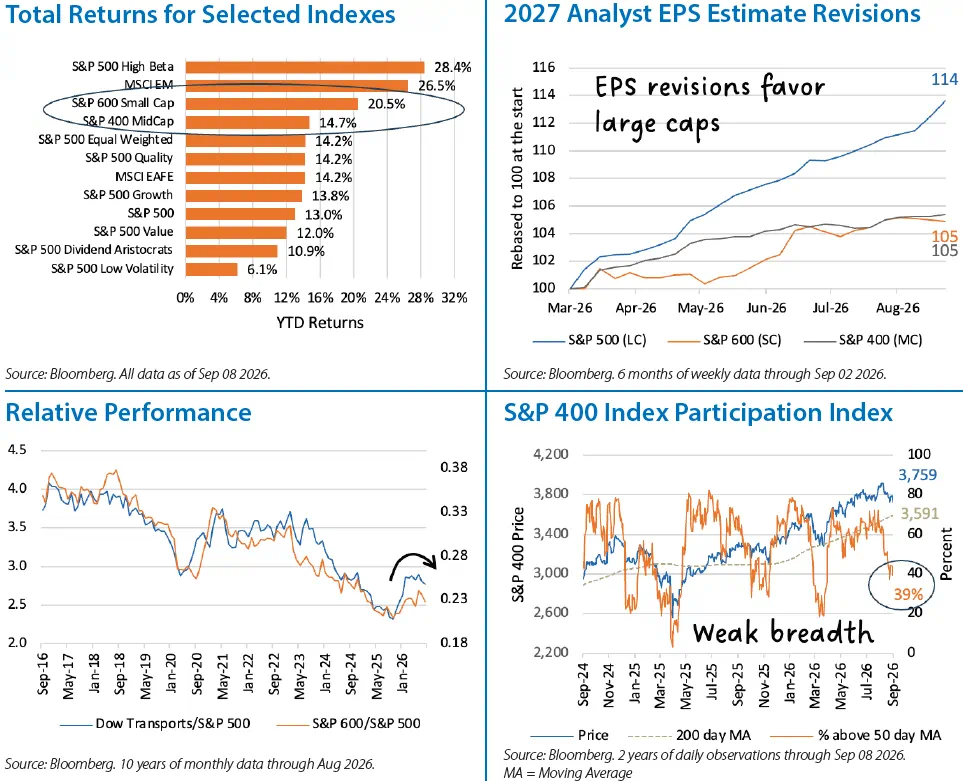
- The case for small and mid cap equities has strengthened, but the evidence remains mixed enough that we are not yet prepared to add exposure. Small caps have outperformed the S&P 500 year to date, while mid caps have also modestly outperformed, confirming that market leadership has broadened beyond the largest companies. Relative underpermace since June, however, shows that the rotation is not yet one-directional.
- Fundamentals continue to improve, but large caps remain a high hurdle. Earnings estimates for small and mid cap companies have moved higher since the spring, but revisions have been considerably stronger for the S&P 500. Improving fundamentals support our existing exposure, but do not yet provide a compelling earnings case for shifting additional capital away from large caps.
- Near-term market signals have cooled. Small and mid cap indexes each fell about 3.2% over the past month versus a 1.0% decline for the S&P 500. Small/mid caps are also lagging over the last 3 months. At the end of August, only about 42% of small and mid cap stocks were above their 50-day moving averages, even though roughly 68% of small caps and 61% of mid caps remained above their 200-day averages. We read that as a loss of short-term momentum rather than a breakdown in the broader trend.
- We also continue to watch the cyclical confirmation signals. Transportation stocks have historically tracked small cap relative performance closely, making their recent leveling-off a reason for patience. Higher interest rates are another constraint: smaller companies carry more leverage and remain more exposed to refinancing costs than large caps, leaving the group more sensitive to Fed policy and the oil-driven inflation outlook.
- Our conclusion is therefore becoming more constructive without becoming more aggressive. Improving fundamentals support our neutral small cap and slight mid cap overweight positions, but large cap earnings remain a high hurdle to increasing small/ mid allocations. We would like to see stronger relative revisions, renewed price momentum and confirmation from broader cyclical indicators before adding exposure.
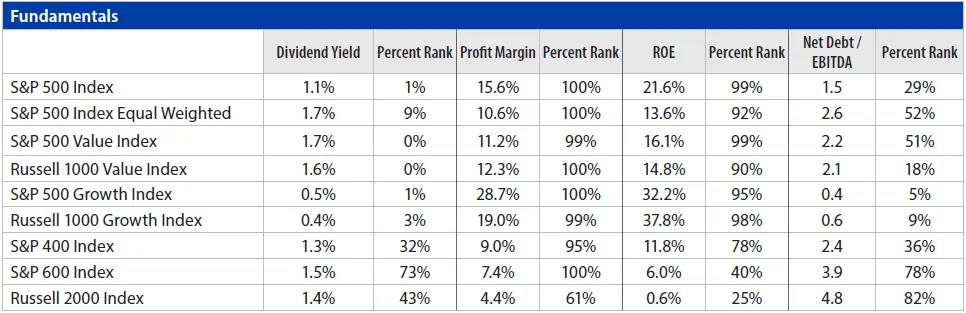
Equity Indexes Characteristics
The Indexes mentioned are unmanaged statistical composites of stock market or bond market performance. Investing in an index is not possible.
Glossary of Investment Terms and Index Definitions
Source: Bloomberg. Percent ranks are based on 30 years of monthly data as of the end of June; EPS growth estimates based on consensus bottom-up analyst estimates
The Touchstone Asset Allocation Committee
The Touchstone Asset Allocation Committee (TAAC) consisting of Crit Thomas, CFA, CAIA – Global Market Strategist, Erik M. Aarts, CIMA – Vice President and Senior Fixed Income Strategist, and Tim Paulin, CFA – Senior Vice President, Investment Research and Product Management, develops in-depth asset allocation guidance using established and evolving methodologies, inputs and analysis and communicates its methods, findings and guidance to stakeholders. TAAC uses different approaches in its development of Strategic Allocation and Tactical Allocation that are designed to add value for financial professionals and their clients. TAAC meets regularly to assess market conditions and conducts deep dive analyses on specific asset classes which are delivered via the Asset Allocation Summary document. Please contact your Touchstone representative or call 800.638.8194 for more information.
A Word About Risk
Investing in fixed-income securities which can experience reduced liquidity during certain market events, lose their value as interest rates rise and are subject to credit risk which is the risk of deterioration in the financial condition of an issuer and/or general economic conditions that can cause the issuer to not make timely payments of principal and interest also causing the securities to decline in value and an investor can lose principal. When interest rates rise, the price of debt securities generally falls. Longer term securities are generally more volatile. Investment grade debt securities which may be downgraded by a Nationally Recognized Statistical Rating Organization (NRSRO) to below investment grade status. U.S. government agency securities which are neither issued nor guaranteed by the U.S. Treasury and are not guaranteed against price movements due to changing interest rates. Mortgage-backed securities and asset-backed securities are subject to the risks of prepayment, defaults, changing interest rates and at times, the financial condition of the issuer. Foreign securities carry the associated risks of economic and political instability, market liquidity, currency volatility and accounting standards that differ from those of U.S. markets and may offer less protection to investors. Emerging markets securities which are more likely to experience turmoil or rapid changes in market or economic conditions than developed countries.
Performance data quoted represents past performance, which is no guarantee of future results. The investment return and principal value of an investment in the Fund will fluctuate so that an investor’s shares, when redeemed, may be worth more or less than their original cost. Current performance may be higher or lower than performance data given. For performance information current to the most recent month-end, visit TouchstoneInvestments.com/mutual-funds.
Please consider the investment objectives, risks, charges and expenses of the fund carefully before investing. The prospectus and the summary prospectus contain this and other information about the Fund. To obtain a prospectus or a summary prospectus, contact your financial professional or download and/or request one on the resources section or call Touchstone at 800-638-8194. Please read the prospectus and/or summary prospectus carefully before investing.
Touchstone Funds are distributed by Touchstone Securities, LLC*
*A registered broker-dealer and member FINRA/SIPC.
Touchstone is a member of Western & Southern Financial Group
Not FDIC Insured | No Bank Guarantee | May Lose Value


