


Active Share Is a Measure of Active Management
In 2006, two Yale professors introduced to the investment community a holdings based statistic called Active Share that measures how "different" an equity portfolio is from its benchmark as well as the proportion of a portfolio that is driving performance. The professors determined there was a positive relationship between fund performance and the fund manager's willingness to be different.
Related studies have examined the relationship between manager conviction and the potential for outperformance. Touchstone views high Active Share and high manager conviction, not as a harbinger of definite outperformance, but as indicators that a strategy has the opportunity to outperform. In such context, Active Share can be a valuable element of investment manager evaluation and fund analysis.
What Is Active Share?
Active Share measures the fraction of a portfolio (based on position weights) that differs from the benchmark index.
The Active Share measure was developed by Martijn Cremers and Antti Petajisto, both Yale professors at the time, as a new way to quantify the degree of active management. Active Share measures the fraction of a fund's portfolio (based on position weights) that differs from the benchmark index.
Exhibit 1 provides a very simplistic explanation of how to calculate Active Share. The hypothetical benchmark consists of two equally weighted securities. Active share is calculated by taking the sum of the absolute difference between all of the holdings and weights in the portfolio and those of the benchmark holdings and weights and dividing the result by two.
The sum of the differences is divided by two to avoid double counting and ensures that the Active Share measure falls between zero and 100%. In this example, the fund has an Active Share of 40%. The remaining 60% is considered the passive share representing the portfolio's holdings and weights that directly overlap with the benchmark.
Exhibit 1
Calculating Active Share
|
Portfolio |
Benchmark |
Absolute |
Active Share |
|
|---|---|---|---|---|
| Security A | 80% | 50% | 30% | |
| Security B | 10% | 50% | 40% | |
| Security C | 10% | 0 | 10% | |
| Sum | 100% | 100% | 80% / 2 = | 40% |
With only 40% of the fund's portfolio devoted to active management one might think that this fund is more index-like, and the authors of the study would agree. The authors established that an Active Share of 60% or higher is generally considered active management. An Active Share of 20% to 60% is considered closet indexing, and an Active Share of less than 20% is considered passive (Exhibit 2).
Exhibit 2
Active Share Levels
| Active | Closet Index | Passive | ||
|---|---|---|---|---|
| 100-80% | 80-60% | 60-40% | 40-20% | 20-0% |
After developing the concept of Active Share, Cremers and Petajisto performed a study to see whether Active Share had any bearing on the relative performance of domestic all-equity mutual funds. What they found was that historically "funds with the highest Active Share significantly outperformed their benchmarks, both before and after expenses, and they exhibited strong performance persistence."
As depicted in Exhibit 3, the studies found that the top quintile of funds by Active Share outperformed their benchmarks, net of fees and transaction costs, by 1.4% annualized. The bottom two quintiles underperformed their benchmarks by 1.4%, annualized. The original study covered the period of 1990–2003. Petajisto updated the study in 2010 to capture the significant market decline in 2008. He found that for the period of 2008–2009 the results were consistent with historic findings. During those two years, funds with high Active Share outperformed their benchmark by almost one percent annualized, net of fees, while all other funds underperformed their respective indices. Both studies also found significant persistence in returns for funds with high Active Share. That is those funds with high Active Shares that outperformed in one year were likely to outperform in the next.
Exhibit 3
Benchmark-Adjusted Returns for Active Share Quintiles*
U.S. Equity Funds 1990–2003
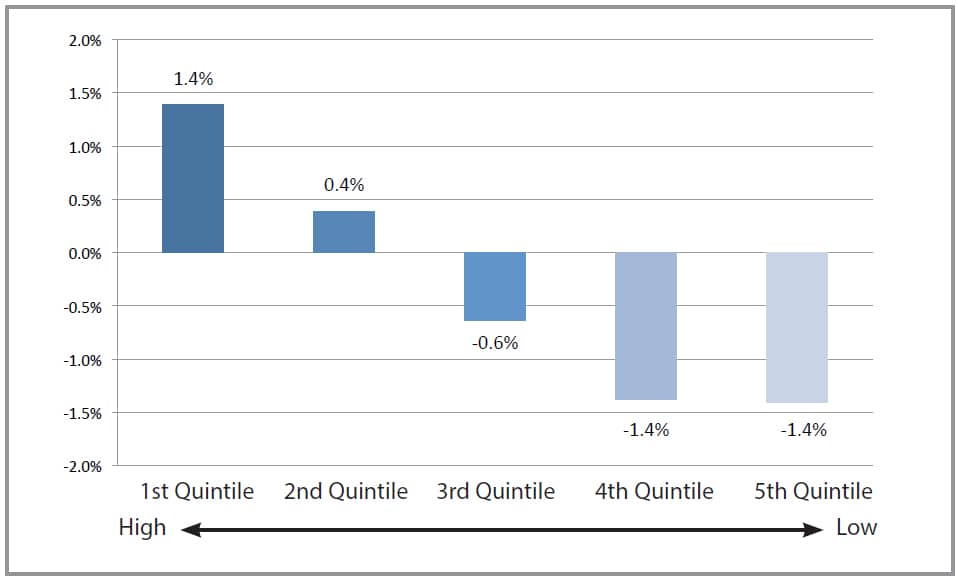
*After fees and transaction costs for all-equity mutual funds in 1990-2003.
Source: "How Active is Your Fund Manager? A New Measure That Predicts Performance," by Martijn Cremers and Antti Petajisto of the International Center for Finance at the Yale School of Management, March 2009.
Why Would Active Share Be Correlated With Performance?
While greater benchmark differentiation creates the opportunity to outperform, it should also create an equal opportunity to underperform. Following that logic, and considering the added cost of mutual fund fees and transaction costs, it would seem likely that even high Active Share funds would underperform. A number of reasons have been proposed for why this was not the case.
Active Share can be thought of as a measure of the proportion of a fund that is driving performance. A fund with a higher Active Share effectively spreads the work across a greater portion of the portfolio, reducing the overall effort needed to drive higher returns. Conversely, a fund with a higher passive share needs to deliver much higher returns on the active portion to outperform the benchmark. This concept may be better expressed through an example. Exhibit 4 displays two hypothetical funds, one with a high Active Share and one with a lower Active Share. The benchmark has a hypothetical return of 8%. To outperform the benchmark by 2%, the return for the active portion of the portfolio with a 30% Active Share has to be much higher to compensate for the greater allocation toward benchmark holdings.
Exhibit 4
High Active Share/Low Active Share
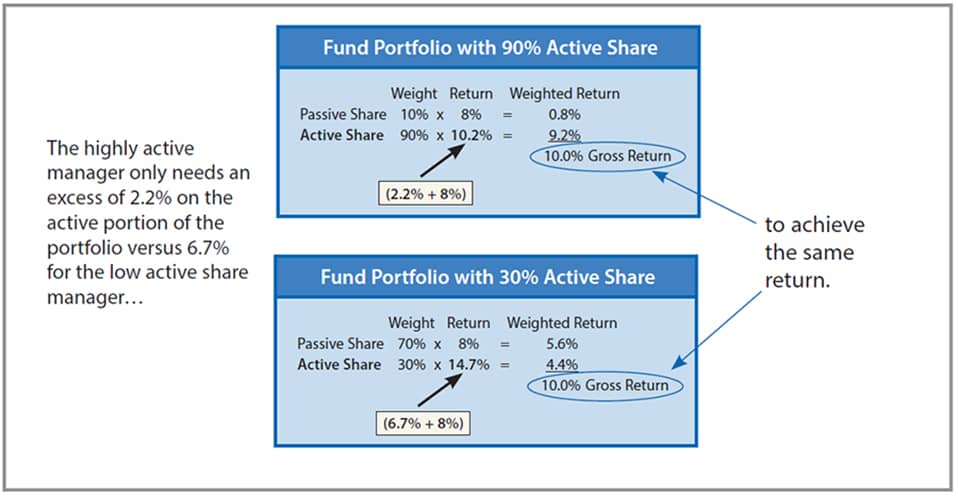
The highly active manager only needs an excess of 2.2% on the active portion of the portfolio versus 6.7% for the low active share manager to achieve the same return.
The same logic applies to fees. With a fund with low Active Share, a greater proportion of the fees go toward passive management and with a fund with high Active Share, a greater proportion of the fees go toward active management. Yet, one would expect that funds with lower Active Share would have lower fees to prevent them from overcharging investors for the greater passive exposure in the portfolio. The study by Petajisto in 2010 found that high Active Share does not mean higher fees.
A closet indexer charges active management fees on all the assets in the mutual fund, even when some of the assets are simply invested in the benchmark index. If a fund has an Active Share of 33%, this means that fund-level annual expenses of 1.5% amount to 4.5% as a fraction of the active positions of the fund. Since only the active positions of the fund can possibly outperform the benchmark, in the long run it is very difficult for a closet indexer to overcome such fees and beat its index net of all expenses.
Another possible reason for the outperformance displayed by funds with Share is that high Active Share is representative of a high level of conviction. A manager with great conviction would be less concerned with the portfolio relative to the benchmark. A manager with less conviction may introduce benchmark holdings to compensate for uncertainty leading towards a more index-like portfolio. This theory, though, rests on the assumption that conviction in and of itself is suggestive of outperformance which is further explored in the Manager Conviction section that follows.
A surprising take away from the Active Share studies was the clear trend away from higher Active Share (Exhibit 5). The percentage of assets in U.S. equity funds (active and passive) with Active Share less than 60% went from 1.5% in 1980 to 50.2% in 2009. Clearly indexing has had an impact on these results. Yet mutual funds with an Active Share between 20% and 60% (the closet indexers) saw their assets grow from 1.1% in 1980 to 31% in 2009 — as such, closet index funds have seen the greatest proportion of asset growth. Assets in funds managed with a high Active Share, (over 80%), have dropped precipitously from 60% in 1980 to just 19% in 2009. While the 2009 data is likely exaggerated — as Active Share tends to come down in periods of high market volatility — the longer term trend is away from high Active Share.
Exhibit 5
Percent of Assets in U.S. Equity Mutual Funds With Active Share ≥80%
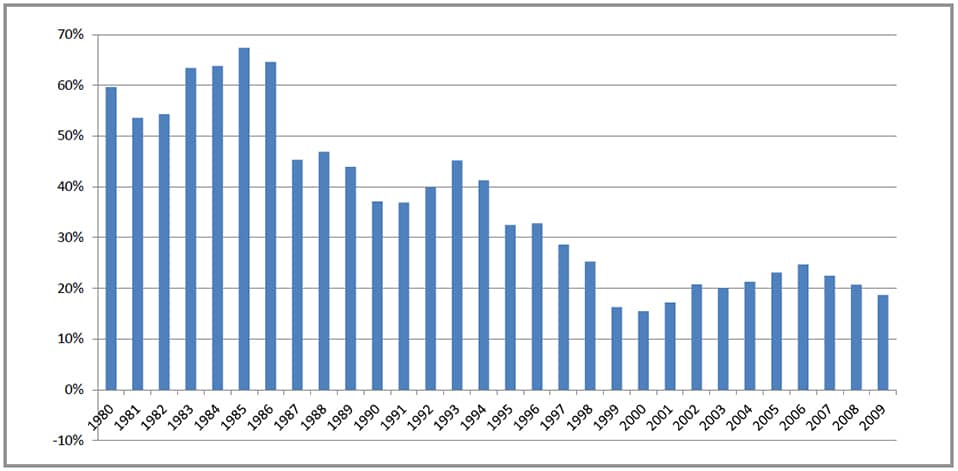
Source: "Active Share and Mutual Fund Performance," by Antti Petajisto of the NYU Stern School of Business, December 2010.
If you have skill, why not apply that skill to your whole portfolio? And if your fund is too large to do that, why not close your portfolio?Cremers and Petajisto speculate that asset growth may be one of the reasons for the trend toward lower Active Share. They note that the data reveals an inverse relationship between assets in a fund and Active Share. As assets grow, managers may have a tougher time maintaining high Active Share. As the saying goes "nothing fails like success," and quite often asset growth can lead to a more narrow opportunity set due to liquidity constraints that prevent managers from allocating new assets to their best ideas, they then add more liquid benchmark holdings. Cremers states in his study: "If you have skill, why not apply that skill to your whole portfolio? And if your fund is too large to do that, why not close your portfolio?"
Does Active Share Provide a Complete Picture of Performance?
Active Share and the Cremers and Petajisto studies are not without their critics. The authors agree that Active Share is not a panacea, but do see it as a very useful tool for evaluating funds. They suggest using it with other measures such as Tracking Error (a measure of the difference between the return an investor receives and that of a benchmark) to get a more complete picture of how a fund is managed.
One criticism relates to the fact that the Active Share calculation can be influenced by the breadth of the benchmark. Small-and mid-cap funds will naturally have higher Active Share than large-cap funds as the small- and mid-cap benchmarks are much broader. One solution would be to compare a fund's Active Share to its peers. One source, ActiveShare.info (a website created and maintained by Martijn Cremers), provides the Active Share calculation and could foster this type of analysis. Still the data and results, as is, are compelling and the authors analyzed funds by market capitalization and found them to be consistent with their overall results.
Another critique relates to risk. It has been suggested that with greater benchmark differentiation one should expect a higher risk profile relative to the benchmark. Yet, risk can be a complicated concept. Two funds could have the same Active Share, but if one is taking active positions in defensive stocks and the other is overweighting highly cyclical stocks, the risk profiles would be very different relative to each other and the benchmark. Touchstone has explicit risk profile expectations based on the nature of the investment discipline. It is true that Active Share is not a useful risk measure, and was not intended for this purpose. There are many other portfolio measures better suited to risk measurement.
The Cremers and Petajisto study has also been questioned due to potential design flaws such as whether the study is simply picking up a small-cap bias. As noted above, smaller-cap funds tend to have a higher Active Share than large-cap funds. However, the study used benchmark adjusted returns and assessed returns adjusted for beta, size, value, and momentum. The authors also analyzed funds specifically by market capitalization and found the Active Share results remained consistent with their overall conclusion.
In 2012 Vanguard performed an independent Active Share study. While the results were consistent with the Cremers Petajisto study in that higher Active Share funds outperformed lower Active Share funds, overall they found that the average results were below the benchmark for all Active Share groups. Unfortunately the design of the Vanguard study was quite different from the original study, making a direct comparison difficult. Additionally, Vanguard, may have unintentionally introduced biases in the design of the study given they are an avowed proponent of index-like investing.
Research on Manager Conviction
A high degree of manager conviction was suggested as one of the reasons funds with high Active Share outperformed funds with lower Active Share. There have been two influential academic studies that specifically look at whether manager conviction may be tied to an expectation of outperformance. Best Ideas, a 2008 study by Randy Cohen, Christopher Polk, and Bernhard Silli asked the question: "What if each mutual fund manager had only to pick a few stocks, their best ideas? Could they outperform under those circumstances?" The results of the study provided powerful evidence that they could indeed outperform. Best ideas were measured by the degree of relative overweight, indicating high manager conviction. While this sounds like an Active Share measure, the study was designed to compare the top picks of all fund managers, regardless of Active Share. While the study's design and intent was quite different from the Active Share study, there was great harmony in the conclusions. The importance of these studies to Touchstone is that they provide evidence of a relationship between more concentrated portfolios and outperformance.
By concentrating their portfolios in those names where they have the greatest conviction, fund managers may avoid over-diversification.
A second study entitled Fund Managers Who Take Big Bets: Skilled or Overconfident, authored by Klass Baks, Jeffrey Busse, and Clifton Green, looked directly at the question of whether more concentrated funds provide any performance advantage over more diversified funds. The study found that "high conviction managers outperform their more broadly diversified counterparts by approximately 30 basis points per month or 4% annualized." The results were consistent across styles and market caps. Both this study and the Best Ideas study present a positive relationship between fund performance and the willingness to take larger positions in a relatively small number of stocks. By concentrating portfolios in those names where they have the greatest conviction, fund managers may avoid over-diversification.
The authors of the Best Ideas study came to two conclusions. First, they believe that the results provide empirical evidence that "the U.S. stock market does not appear to be efficiently priced, since even the typical active mutual fund manager is able to identify a stock that outperforms." If this is true, though, why wouldn't fund managers simply focus on those ideas where they have the most conviction? The authors' second conclusion answers this question by indicating that there are a number of "institutional factors" that encourage over-diversification. These institutional factors include career risk, financial incentives, and popular risk-adjusted return measures such as the Morningstar star system.
Career risk addresses the fact that in many cases a portfolio manager's job is based on performance. Combine that with evidence that investor's perception of risk is asymmetric (investors view underperformance much more harshly than they reward outperformance) then one can understand the pressure on a manager to mitigate benchmark risk and provide more benchmark-like returns. Studies have shown that investors are generally less likely to sell or redeem mediocre funds. As such, some portfolio managers may add benchmark names to the portfolio simply to mitigate career risk and not because they see them as good investments. The addition of benchmark names to the portfolio may reduce risk relative to the benchmark, but may also reduce the overall actively managed portion of the fund. Microsoft in the late 1990s and Apple today provide good examples of stocks that get tucked into portfolios simply to mitigate the risks posed by such a large holding in the benchmark.
Asset management firms have a business model that earns revenue based on the amount of assets under management. This may create financial incentives to grow assets, often beyond the capacity for generating alpha. Managers may diversify the portfolio into highly liquid benchmark names simply to satisfy asset growth. At Touchstone, as part of our due diligence, we analyze compensation and the degree to which it aligns with shareholder interests. We prefer some component of compensation to be directly tied to performance.
Risk-adjusted return measures like the Sharpe Ratio and the Morningstar star rating system heavily penalize idiosyncratic risk (stock specific risk) making it difficult for concentrated and differentiated funds to receive high ratings using these measures, even if there is outperformance in absolute returns. The importance of ratings in gathering assets cannot be understated. The vast majority of all inflows to mutual funds are to four- and five-star overall Morningstar rated funds. In order to score more favorably a manager can reduce idiosyncratic risk through greater diversification.
This last point raises an interesting line of reasoning. The Big Bets study takes issue with these risk-adjusted return measures believing they often do more harm than good. The relevance of risk-adjusted returns for an investor is best placed on all of the investor's assets, not individual holdings or mutual funds. As such, investors who attempt to build a portfolio of funds based on these risk-adjusted return measures may be creating a sub-optimal total portfolio. Further, the authors found that the holdings of more concentrated funds rarely overlap, as combining funds of more concentrated managers would improve the performance potential for the basket of funds while decreasing overall portfolio risk.
Identifying High Active Share Managers
If one chooses an active route, these studies suggest that the more benchmark differentiation the better potential for outperformance.
By outsourcing the money management function, Touchstone focuses on identifying managers to sub-advise our funds. Evaluating experienced institutional asset managers with established reputations across a wide range of asset classes adds credence to the sub-advisory model. Many active managers do outperform; our quest is to find those managers through careful selection and ongoing due diligence. While higher Active Share is a desirable and broadly representative characteristic of Touchstone's equity funds, we view high Active Share, not as a harbinger of definite outperformance, but as an indicator that a strategy has the opportunity to outperform.
Touchstone‘s research approach is focused entirely on identifying and monitoring current and potential sub-advisors of Touchstone Funds. We apply a rigorous, multi-faceted due diligence process that evaluates each manager based on five broad areas of criteria; within each of these are important sub-components. A number of these components naturally lead us towards managers that tend to be more benchmark agnostic with more concentrated portfolios. Being different from the benchmark should not be an end in itself. The reasoning and disciplined investment process that leads to portfolio differentiation are what attracts us to a manager. We see investing as multifaceted and highly competitive. A strict adherence to the manager's stated methodology, a stable personnel profile, a robust investment infrastructure and experience over several market cycles are all equally important considerations.
The Active Share measure and the concepts of best ideas and big bets (concentration) and the conclusions of the various studies referenced are thought-provoking, but certainly, are not meant to address the active versus passive debate. If an investor chooses to take a passive approach, assessing which active managers are likely to outperform may be deemed irrelevant. However, if one chooses an active route, these studies suggest that the more benchmark differentiation the better potential for outperformance.
This material should not be considered as investment advice or a recommendation of any particular security, strategy or investment product. There are no assurances that any strategy or investment approach will meet its objective.
This information contained is derived from sources Touchstone believes are reliable, but accuracy cannot be guaranteed. Charts, graphics, and formulas included are for illustration purposes only.
Index performance is not indicative of fund performance. Investing in an index is not possible.
Performance data quoted represents past performance, which is no guarantee of future results. The investment return and principal value of an investment in a Fund will fluctuate so that an investor's shares, when redeemed, may be worth more or less than their original cost. Current performance may be higher or lower than performance data given. For performance information current to the most recent month-end, visit Mutual Funds for pricing and performance data.
Please consider the investment objectives, risks, charges and expenses of the fund carefully before investing. The prospectus and the summary prospectus contain this and other information about the fund. To obtain a prospectus or a summary prospectus, contact your financial professional or download and/or request one at Resources & Tools. Please read the prospectus and/or summary prospectus carefully before investing.
Investment return and principal value of an investment in a Fund will fluctuate so that investor's shares, when redeemed, may be worth more or less than their original cost. All investing involves risk.
Touchstone Funds are distributed by Touchstone Securities, Inc., a registered broker-dealer and member FINRA/SIPC.
Investment products offered are not FDIC insured, may lose value and have no bank guarantee.
Sources:
Randy Cohen, Christopher Polk, and Bernhard Silli, May 2010, Best Ideas, The Paul Woolley Centre Working Paper Series # 3
Klass Baks, Jeffrey Busse, and Clifton Green, March 2006, Fund Managers Who Take Big Bets: Skilled or Overconfident, American finance Association 2007 Meetings Paper
Martijn Cremers and Antti Petajisto, March 2009, Updated, How Active Is Your Fund Manager? A New Measure That Predicts Performance, Review of Financial Studies, Yale School of Management
Antti Petajisto, December 2010, Active Share and Mutual Fund Performance, Working Paper NYU Stern School of Business
Touchstone Securities, Inc. has partnered with Professor Martijn Cremers to provide consulting services. Touchstone and Professor Cremers are independent of each other.


